In addition to the data layers already available to you in the Layer List Widget, you can add additional data layers to your map.
-
You may select a Layer from ArcGIS Online.
-
You may add a Layer if you happen to know the REST URL of the map service.
-
You can add points from a CSV File if they have Lat/Long coordinates.
-
You may even add a Shapefile from your local device.
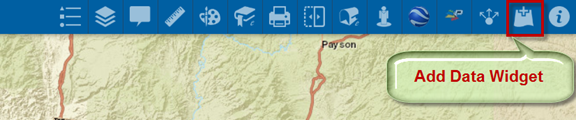
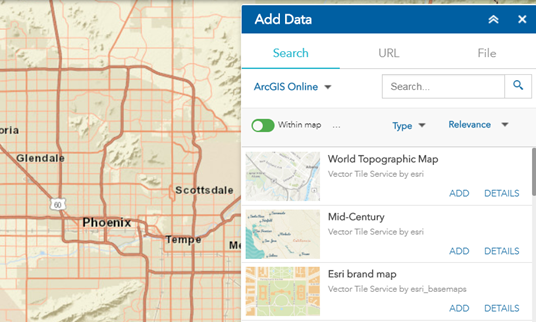
Open the Add Data Widget.
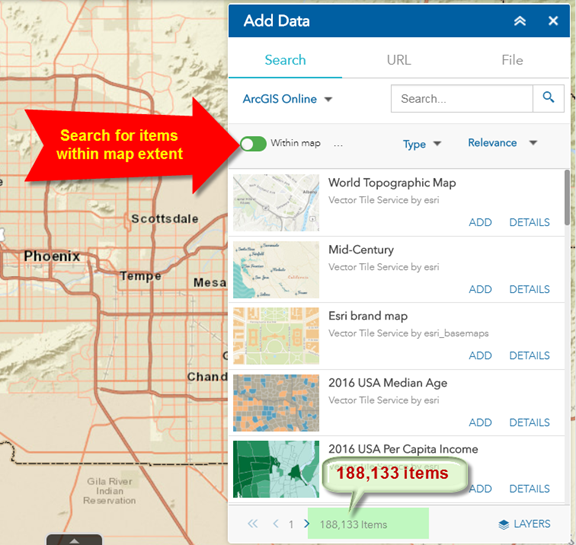
By default, you will be searching for items within your current map extent.
There are over 188,000 items available to you.
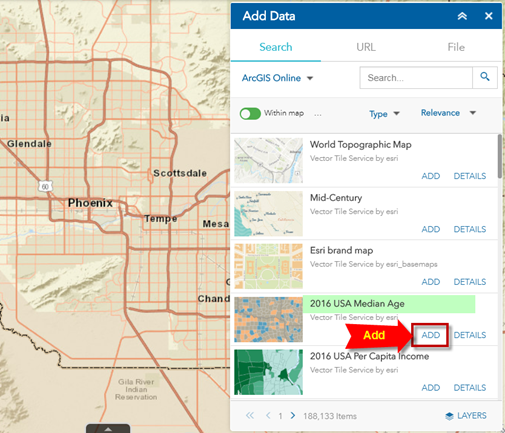
Add the 2016 USA Median Age Vector Tile Layer.
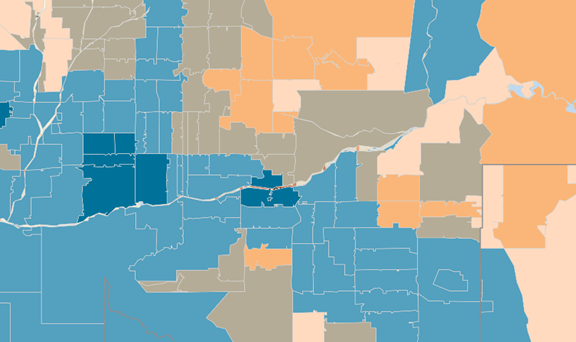
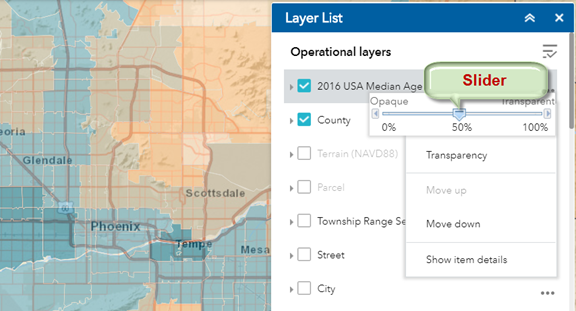
The Layer gets added to the top of the stack.
You would need to change the transparency to see the Layers below.
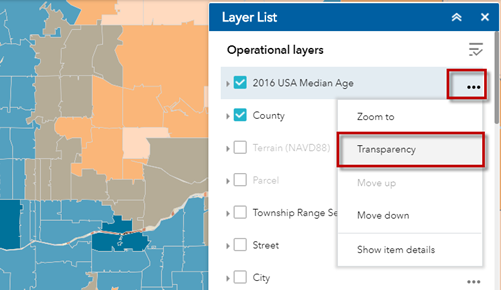
Open the Layer List Widget.
Expand the Menu for the 2016 USA Median Age Layer.
Click Transparency
Adjust the Transparency Slider.
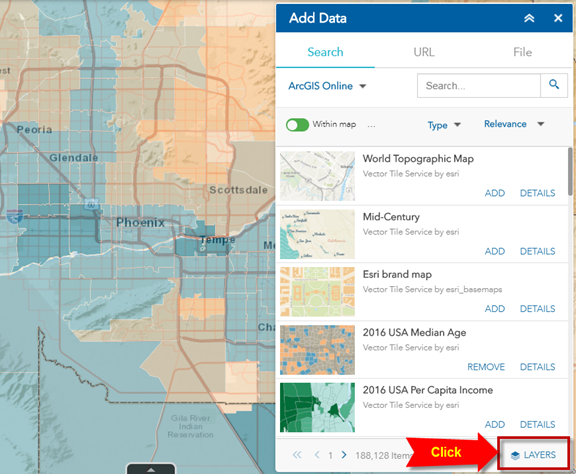
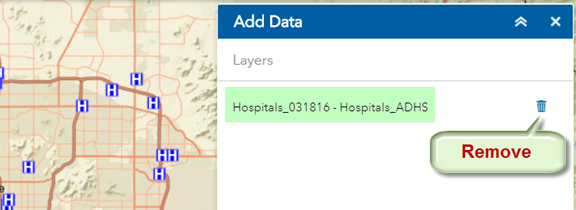
To remove this layer, open the Add Data Widget.
Click on LAYERS
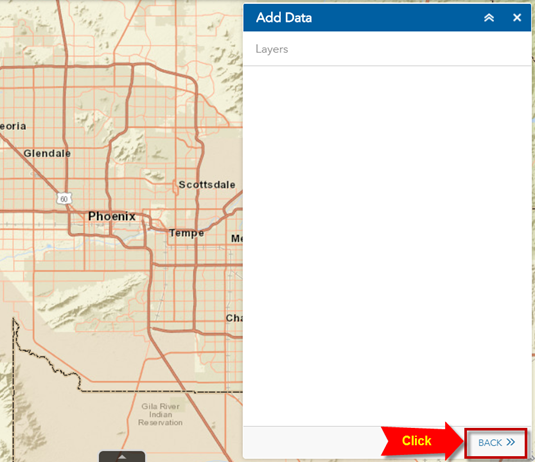
Remove the Layer.
Click on the BACK button.
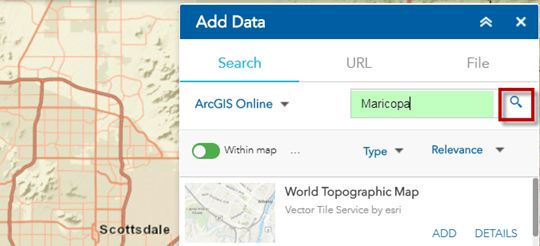
If you know the name of the Layer, you can enter that in the Search box.
You may also search by a Keyword.
Enter Maricopa
Press the Search icon.
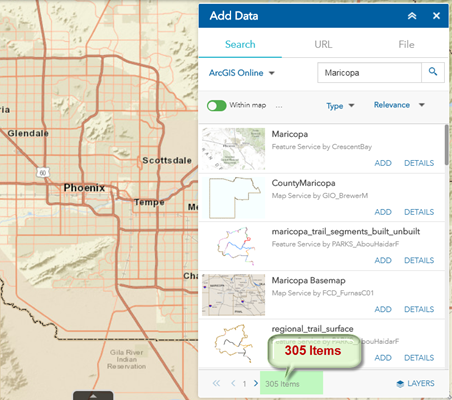
There are 305 items with the keyword Maricopa within your map extent.
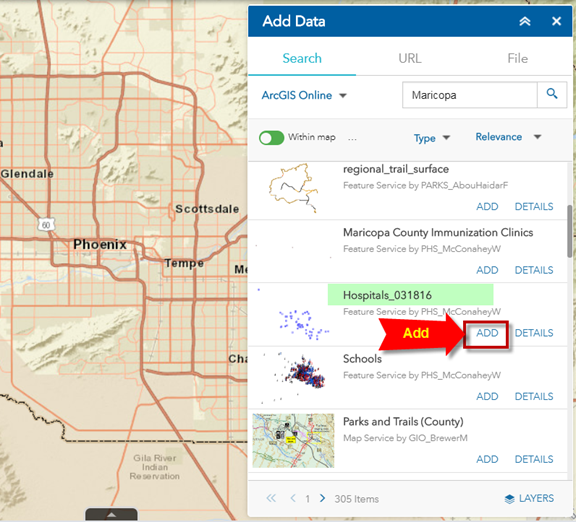
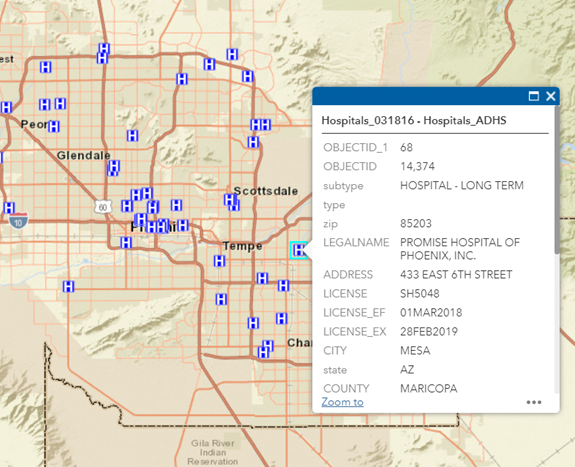
Add the Hospitals Layer.
Your map now includes the Hospitals in Maricopa County.
Remove this layer.
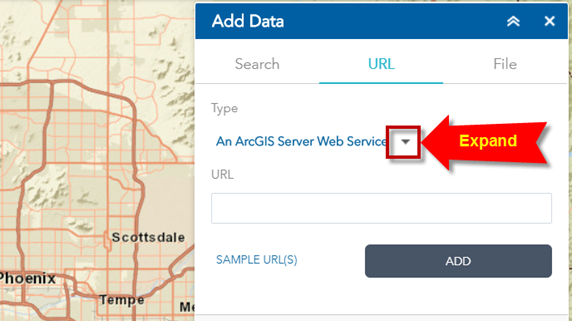
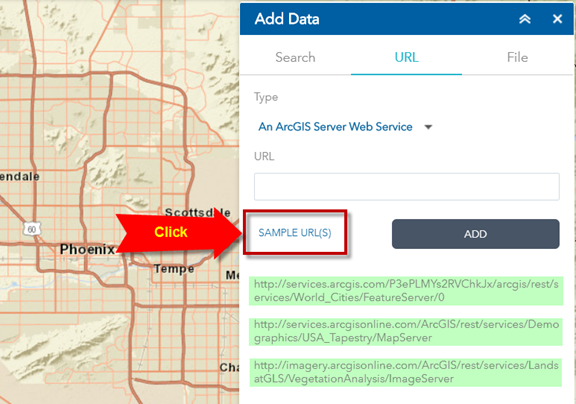
If you know the URL to an ArcGIS Web Service, you may use that.
Open the URL Tab.
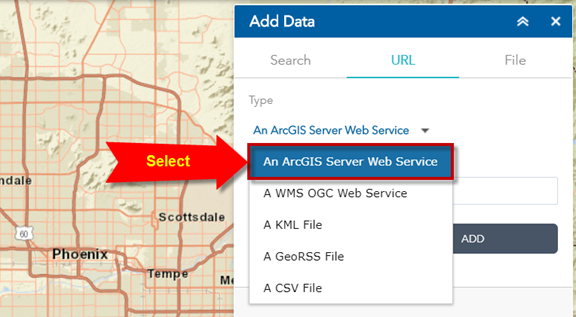
Click on the down arrow to view your choices.
Select An ArcGIS Server Web Service
Click on SAMPLE URL(S) to view some examples:
Enter this URL:
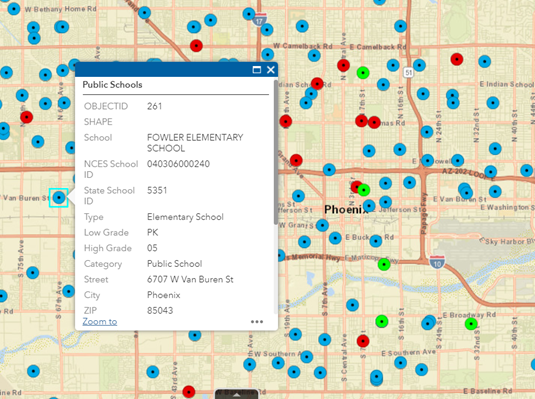
This map service shows all the Public Schools in Maricopa County.
Remove this Layer.
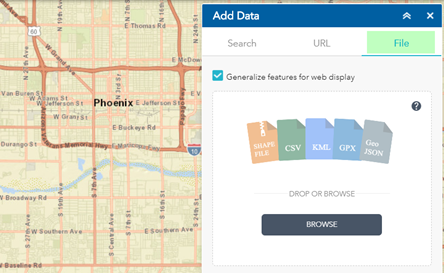
You may also add data from a CSV file or a Shapefile that resides on your device.
Open the File Tab.
Your Comma Separated Values (CSV) File can be a list of Point Features.
You must include a Latitude/Longitude value for each record.
Here is a sample CSV file with 5 lines.
Schools.csv
---------------------------------
Name,Latitude,Longitude
ABRAHAM LINCOLN TRADITIONAL SCHOOL,33.581391,-112.142829
ACACIA ELEMENTARY SCHOOL,33.616805,-112.122817
ADAMS ELEMENTARY SCHOOL,33.401503,-111.865764
ADOBE MOUNTAIN SCHOOL,33.699962,-112.120609
The first item shows the Name of the School.
The next two items show the Latitude/Longitude values in Decimal Degrees.
For locational accuracy, you must include 6 decimal places.
The Datum for these Geographic Coordinates must be WGS84.
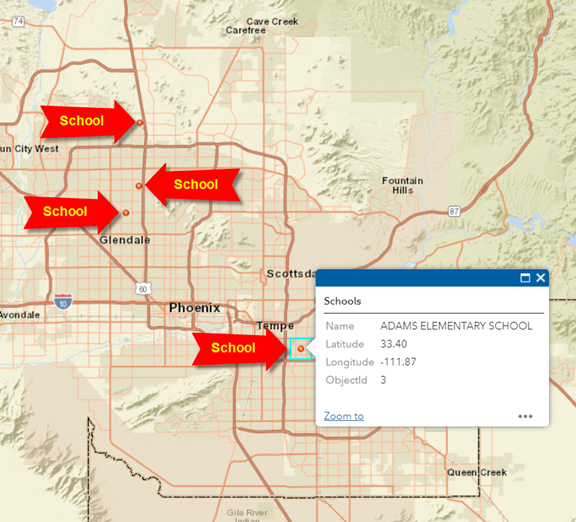
Either browse for Schools.csv file or drag & drop it.
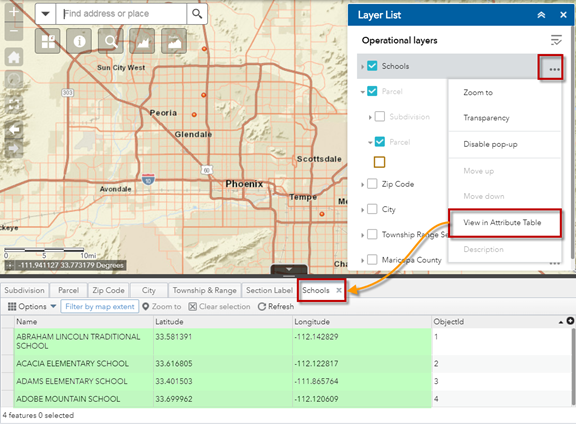
This is how the 4 points representing the 4 Schools appear on the map.
Open the Layer List Widet.
You have added the Schools Layer.
Expand the menu and select View in Attribute Table.
Dragging and dropping a CSV File over your map is a quick way of visualizing your data points if you happen to have the Lat/Long coordinates.
Important: There is a limitation of 1000 records.
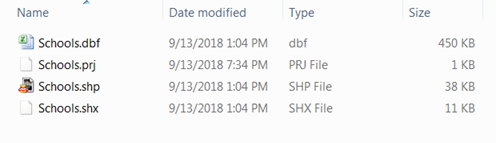
You may also add a Shapefile to your map.
The Shapefile must have the following essential components:
Example:
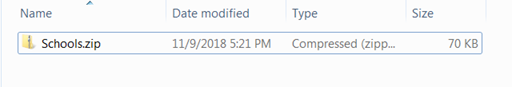
Before you can add this Shapefile, you must ZIP the components into a single file like this:
You can now add Schools.zip to your map.
Important: There is a limitation of 1000 records.
Note: No matter what the projection of your Shapefile, the Web Application will always reproject it on the fly to Web Mercator so that it overlays properly on the existing data layers.
This is why you must always include the .prj file. It contains the projection information of your Shapefile.
All the data layers in the Web App are in Web Mercator meters.